Get started with Graphpro
To start with the software, we need either a specific protein or a MD simulation, we can download a public simulation of the Adk protein opening.
!gdown 1NwFINNlKYDhYrlpB6o4lPyftl-UMq7vk
!gdown 1VHXDJu_i6LUNpwYYuKhrdmMB9nKuFImq
GraphPro allow a simple integration with MDAnalisys, allowing scienties that are familiar with the tool to use its power to boost research on geometrical learning.
import nglview as nv
import MDAnalysis as mda

pdb_file = 'MD05_ADK_protein_fit_tiny.pdb'
trajectory = 'MD05_ADK_protein_fit_tiny.xtc'

u = mda.Universe(pdb_file, trajectory)

view = nv.show_mdanalysis(u)
view.add_surface(selection="protein", opacity=0.8)
view.background = 'gray'

view
Static graph generation
Graphpro uses package to generate from a set of trajectory represenations. md_analisys, cretes a generator, that enable to generate graphs from static files or trajectories.
In this example a contact map with cutoff of 8 angstroms is use to generate the graph representaton per residue.
import graphpro as gp
from graphpro.graphgen import ContactMap

graph_gen = gp.md_analisys(u)
G = graph_gen.generate(ContactMap(cutoff=8))
G.plot(figsize=(6,6))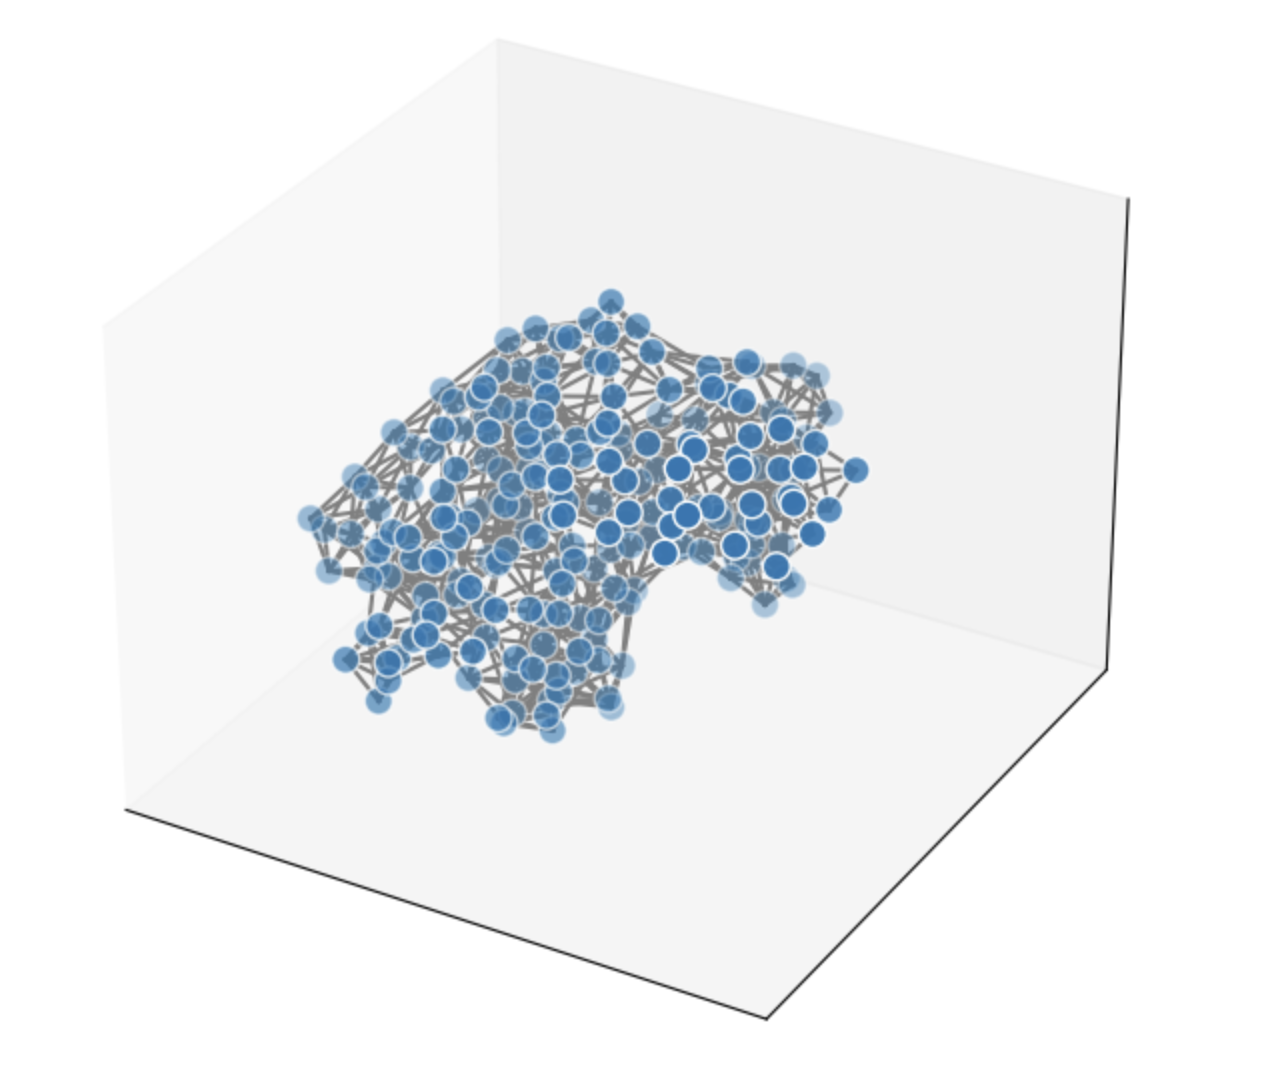
Trajectory generation
Using the same generator we can generated a set of graphs over the trajectory file that returns us a graph collection with a graph each frame.
trajectory_graphs = graph_gen.generate_trajectory(ContactMap(cutoff=6))
len(trajectory_graphs)
In this simulation we can see how AdK closes the active side pocket, we can see this been relected in the approximate diam change on the graph structure.
from networkx.algorithms import approximation

diameter_in_frame = [approximation.diameter(graph.to_networkx()) for graph in trajectory_graphs]
import matplotlib.pyplot as plt plt.style.use('ggplot') plt.title('Adk trajectory closing ') plt.xlabel('frame') plt.ylabel('graph diameter') plt.plot(diameter_in_frame)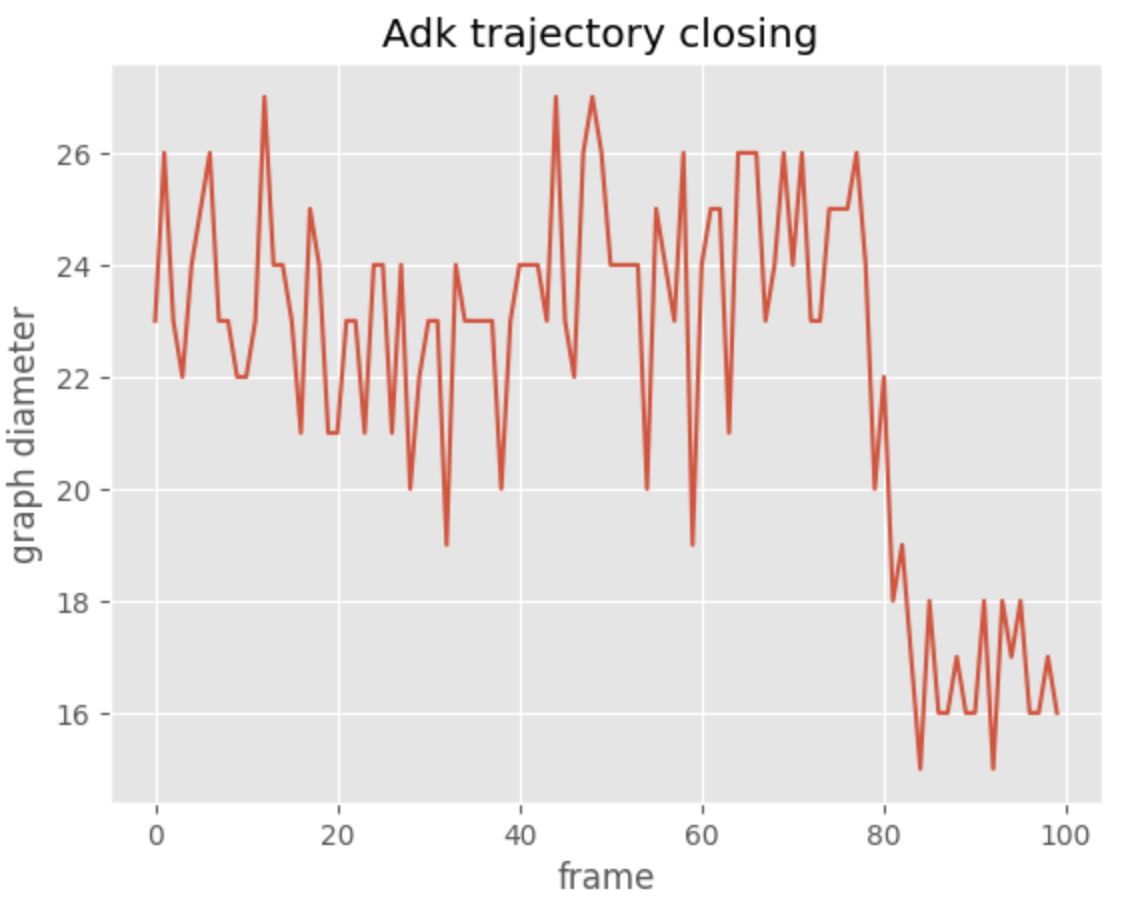
Towards geometrical learning
More importantly, the specific collection of anotated graphs can be gransform to a gemetric data structure.
The basic method to_data, allow the transfomation of our internal graph representation to PyG Data.
This holds an homegenus graph representation that holds both node level attributes as well as edge attributes.
data = G.to_data()

# Analyzing the graph structure:
print(data.num_nodes)
print(data.is_directed())